Townsville SOE home page


Measuring the Wind
Calculating Power Output

Taking wind speed readings on the Townsville Strand with a hand held meter.

Taking wind speed readings on the Townsville Strand with a hand held meter.


Calculating the power output from a wind turbine requires knowledge of the wind turbine capabilities and the local wind conditions.

The power output of the Strand Wind Turbine was calculated by processing the average wind speed data measured from a weather station in the Townsville Port Shipping Channel, into a calculator program developed by Ropatec.

However, for large scale commercial wind farm projects, a more rigorous approach to calculating wind conditions is required. The information below describes this approach.

Measuring the Wind

An important first stage for a wind project is collecting wind data.

Data about wind speed and direction in a particular area can be used to develop predictive models of power output from a wind turbine and these can be used for economic analysis.

Good quality wind data for the Townsville region has been collected by the Australian Institute of Marine Science from a weather station located in the Townsville shipping channel.

However, when wind data has been collected some distance away from the site of a proposed wind farm, there may be some variance in the wind speeds between the two sites.

It is possible to use powerful computers to model what the wind speeds will be in one area using data collected somewhere else.

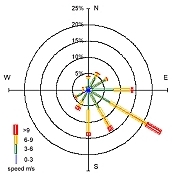
This work has been conducted for two locations in Townsville by the CSIRO Wind Energy Research Unit . This analysis was created for the Townsville Port, and the Cleveland Bay Purification Plant Site, as part of the Townsville City Council Carbon Neutral Water Recycling Project. See below for the Results of the Cleveland Bay Wind Modelling.

(Unfortunately, the geographical extent of these calculations did not reach to the Rock Pool end of the Strand so it has not been possible to cross-check the figures against the projections for the Strand Wind Project).

These calculations form the basis of a pre-feasibility study for a commercial wind farm. To get a more accurate understanding of the wind conditions it is necessary to erect a wind monitoring station on site. This will allow the collection of wind data from the location of the proposed wind power site.

A wind monitoring station was erected at the Cleveland Bay Purification Plant site in June, 2004.

Once tweleve month's worth of onsite wind data has been collected, this data can be analysed and feed into a feasibility study. The feasibility study may consider:

  • potential power yield of the site
  • electrical engineering issues
  • connection to the mains grid
  • aesthetics
  • finance
  • power purchase arrangements

Results of the Cleveland Bay Wind Modelling assessment for Townsville City Council.

The picture below shows the Mean Annual Energy Yield, measured in gigawatt hours, electrical energy per annum per turbine, assuming the use of a REpower MM70 wind turbine. This analysis was conducted for the Citiwater Carbon Neutral Water Recycling Project.

Mean Annual Energy Yield
Mean Annual Energy Yield (gigawatt hours per annum)

Wind Speed and Direction

Wind Speed and Direction

This table is known as a wind rose. It shows that the predominant wind direction at the CBPP site is in the southeast sector (trade winds). Winds from other directions are typically much lighter.

Average Wind Speed in Each Sector.

Average Wind Speed in Each Sector.
Average Wind Speed in Each Sector

This graph shows the direction of the wind and the average wind speed from each direction. It shows that a large proportion of the wind comes from between east and south.

Average Wind speed for two-hourly intervals
Average Wind speed for two hourly intervals
Average wind speed for two-hourly intervals

This graph shows the wind strength in relation to the time of day. It can be seen that there is generally more wind from between 6pm to 6am.

Wind Speed Probability Distribution

This table shows the average probability distribution of wind speeds.

Wind Speed Probability Distribution

Mean Annual Wind Speed

Mean Annual Wind Speed

This table shows the mean annual wind speed across Townsville. Legend on the right of the image shows annual average wind speed in metres per second.


Townsville City Council Home PageErgon Energy - Australian largest electricity company


Sustainable Townsville Townsville Solar Cities Toyota Prius Strand Wind Project Supporting "Creek to Coral" Stormwater Quality Management Townsville Bikeways Sustainable Townsville