|
Citiwater Cleveland Bay Wind Monitoring Program. Citiwater is monitoring the wind resource at its Cleveland Bay Purification Plant to support the use of commercial wind power. |

|
- In support of Citiwater Objectives and the Citiwater Carbon Neutral Water Recycling Project - Commissioned May, 2004 - Measuring Wind Speed and Direction - Adds to existing assessment of wind speeds |
Over the past few years there has been much interest in commercial wind power in Townsville. Citiwater has taken the lead in the development of commercial wind energy in Townsville through its wind monitoring program. This initiative is in support of the Citiwater Objectives and the relates directly to the Citiwater Carbon Neutral Water Recycling Project. In 2003 Citiwater received a prefeasibility study (.pdf 554Kb) of the the winds on its Cleveland Bay Purification Plant (CBPP) site. The wind modeling data was provided by CSIRO Wind Energy Research Unit and represented an extrapolation of wind data logged by a weather monitoring station in the Townsville Port shipping channel. This data was collected by the Australian Institute of Marine Science. See results. The Citiwater assessment follows a similar assessment of the wind resource of the Townsville Port Authority a few years before. The CSIRO technique involved modeling the shipping channel data with the local topography to enable an estimate of the wind resource on the CBPP site. This data showed an average wind speed of around 6.9 metres per second. See CSIRO Wind Resource Planner's Guide V1.1 (.pdf 6.5Mb!). For the purposes of commercial wind power projects, however, this extrapolated data is insufficient to develop accurate cost benefit analysis. It is therefore necessary to collect real wind data on the site. In May, 2004, Citiwater commissioned a wind monitoring station to collect this data. |
 |
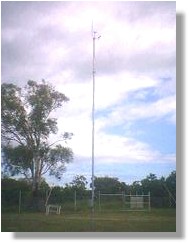
In order to generate quality information about wind energy at the Cleveland Bay site, Citiwater has purchased a wind monitoring station, shown here. This is a 10 metre high tower holding instruments that measure wind speed and direction and a data logger to collect the data. The wind monitoring station was commissioned in May, 2004. |
The wind monitoring station is a NRG Symphonie data logger. Data is manually collected by downloading from the logger to a laptop computer. This data is then processed in to graphs showing wind speed and direction at 10 metres elevation. Shown here is the box holding the data logger and the photovoltaic solar power system to power the data logger. |
|
|
The data logger and its electronics are stored inside a weather proof box. Shown here is the data logger in its blue casing, a small battery to store the charge from the solar panel and the solar panel's regulator (attached to the door). |
After 12 months data is collected (May 2005), it is planned to send the data to CSIRO who will model the data to 65 metres elevation. From here it will be possible to calculate power output and thus cost benefit of various wind turbine systems. NRG Symphonie Brochure (.pdf 65Kb) |
|
Picture Source: NRG Systems |
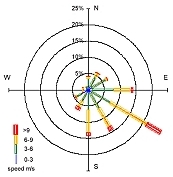
The Cleveland Bay Wind Purification Plant Wind Data Download the Data (.zip 1.5Mb!) Below is the data generated by the wind monitoring station. |
May 2004
|
June 2004
|
July 2004
|
August 2004
|
September 2004
|
October 2004
|
November 2004
|
Wind Rose May - September 2004
|