 | |||||
|
| |||||
| |||||
|
Home
> Status
Report > Chapter
2 - Physical Environment > 2.1
Weather & Climate of Cleveland Bay
| |||||
|
|
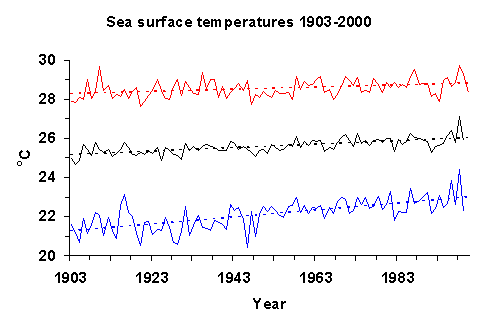
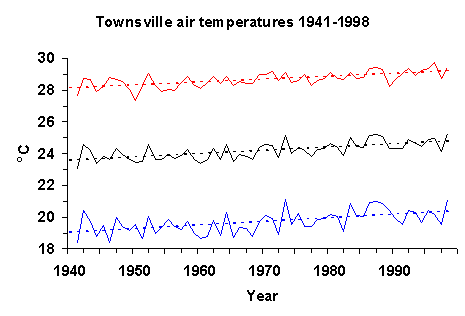
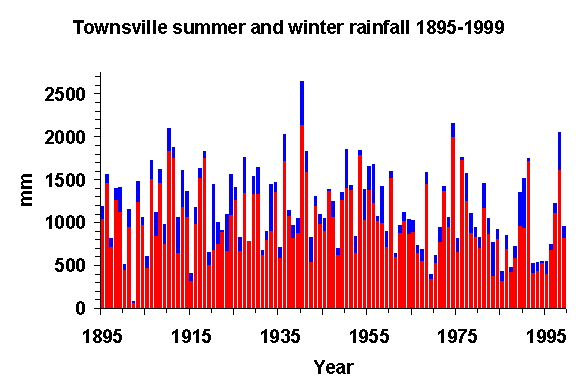
2.1.5 Climate of the past centurySSTs around Cleveland Bay have, in keeping with the rest of the GBR (Lough 1999), significantly warmed over the past century (Figure 3). Annual average SSTs are 0.6oC warmer in the last 30 years of the 20th century compared with the first 30 years of the century. As has been occurring in Queensland (Lough, 1997), air temperatures in Townsville have also been rising (Figure 4). Annual average temperatures for the most recent 20 years of record (1979-98) are 0.5oC warmer than in the first 20 years of record (1941-60). Warming has been slightly greater for minimum (nighttime) temperatures which have increased by 0.9oC over the same time period. Rainfall in Townsville is characterized by considerable inter-annual and inter-decadal variability (eg wetter 1950s and 1970s) and shows (similar to Queensland, see Lough, 1991, 1997) no significant trend over the past century towards wetter or drier conditions (Figure 5).
Figure 2.3 Average annual (black), maximum (red) and minimum (blue) sea-surface temperatures at 19.5oS, 147.5oE from 1903-2000. Dashed lines are linear trend lines.
Figure 2.4 Townsville AMO annual average (black line), annual maximum (red line) and annual minimum (blue line) air temperatures, 1941-1998. Dashed lines are linear trend lines.
Figure 2.5 Townsville total summer (red bar) and winter (blue bar) rainfall, 1895-1999. Total height of bars give annual total rainfall for water year (October-September). |
|
This page was last updated on Monday 8 April
2002 | |